AWS incident reconstruction

Every AI tool guesses the cause.
Ours shows the chain of events.

Ask what happened. KubeOpsAI reconstructs the infrastructure chain from CloudTrail, AWS Config and Kubernetes — and every link cites a source event ID, timestamp and actor. Causality comes from timestamp ordering and declared resource relationships, not from a language model's opinion.

Stop spending 90 minutes in the CloudTrail console the morning after.

MCP Server $0 forever AI assistant access to your cluster. Free & open source. See what's included →
KubeOpsAI $199 /month Evidence-cited incident reconstruction. 1 cluster. See what's included →
Enterprise $699 /month Unlimited clusters, Jira, audit log, private LLM endpoint. See what's included →

Why Engineers Buy This

The story that sells itself

Every paying customer went through some version of this. Maybe you have too.

1
Saturday · 3:15 AM
The pager goes off. The scramble begins.

PagerDuty fires. High Latency — Payment Gateway. You roll out of bed, grab your laptop, and start the ritual you've done a hundred times before.

3:15Laptop open. VPN connecting. Okta MFA.
3:19AWS Console. Log into Grafana. Find the right dashboard.
3:24Querying Prometheus. Checking Loki. Cross-referencing timestamps.
3:31Pulling K8s events. Checking recent deployments. Still no clear answer.
3:40Found it — a database migration from yesterday locked a table. That's the latency spike.
3:43Roll back the deployment. Wait for pods to stabilize.
4:30Incident closed. Laptop shut. Sleep is gone.
⏱️
25 minutes of manual triage to answer one question: what broke and why? Every tool you needed was already connected to your cluster. You just had to be awake to ask it.
2
Monday · 9:00 AM
There's a free tool that does this in 5 minutes.

In the incident review, a colleague mentions they've been using an open-source MCP server that gives AI assistants like Claude or Amazon Q direct read-only access to the cluster — logs, metrics, K8s events, deployments, CloudTrail, all of it.

No dashboards. No tab-switching. You just ask a question in plain English and the AI queries everything at once.

💡
It's completely free. One Helm install. Works with Claude Desktop, Amazon Q, Kiro, or Cursor. The same 25-minute investigation you just did manually? It takes under 5 minutes when you're at a keyboard and can just ask.
3
Tuesday · 2:00 PM
You install it. A staging issue hits. Watch what happens.

The checkout pod keeps restarting in staging. You open Claude Desktop and type one question.

👤
You
Why did the checkout pod restart 10 minutes ago?
✦
Claude · via k8s-telemetry-mcp
The pod was OOMKilled at 13:51 UTC. It hit its 512Mi memory limit while processing a large JSON payload — the spike is visible in the last 3 log lines before termination. The get_k8s_events call shows this has happened 3 times in the last hour, all triggered by the same request pattern. Recommended fix: increase the memory limit to 768Mi and add a payload size guard on the /checkout/process endpoint.
✓
Fixed in 3 minutes. What used to mean 20 minutes of tab-switching is now one question. You share the AI's response in the team Slack channel. Your tech lead asks where it came from.
4
The next 3 AM page
What if it didn't need you at the keyboard?

The free tool is great — when you're awake and at your desk. But the worst incidents don't happen at 2 PM on a Tuesday. They happen at 3 AM on a Saturday, when nobody is sitting in front of Claude Desktop.

KubeOpsAI Agent closes that gap. It hooks directly into Alertmanager. The moment an alert fires, it runs the same investigation automatically — no human prompt needed — and posts an evidence-cited root-cause analysis to your Slack incident channel before PagerDuty even wakes anyone up.
Without KubeOpsAI AgentPaged at 3 AM → 25 min triage → fix → back to sleep at 4:30
With KubeOpsAI AgentPaged at 3 AM → RCA already in Slack → fix → back to sleep by 3:10
What the agent doesInvestigates, correlates, explains
What your engineer doesReads the RCA, runs the fix
Cost$199/mo for 1 cluster — less than 2 hours of on-call time
🔒
Read-only by design. The agent never touches your cluster — it only reads. Your engineer still makes the call and runs the fix. That's exactly why security teams approve it without a lengthy review.
Subscribe on AWS Marketplace — $199/mo, 1 cluster

Free MCP Server

Your AI assistant, inside your cluster

One Helm install. Point Amazon Q, Claude, Kiro, or Cursor at it. Ask anything about your cluster in plain English.

📋

Logs

Query and analyze pod logs via Loki, Datadog, or CloudWatch. Pattern detection, error categorization, and recommendations built in.

📈

Metrics

PromQL queries and cluster health via Prometheus. CPU, memory, restarts, network throughput, and SLO compliance.

🔍

Traces

Distributed trace search and retrieval via Grafana Tempo. Pinpoint slow requests and error traces across services.

⚡

Analytics

Incident timelines, SLO checks, cost attribution, and alert enrichment — correlating data across all sources automatically.

☸️

Kubernetes

Events, recent deployments, HPA scaling history, and node pressure — pulled directly from the Kubernetes API.

☁️

AWS

CloudTrail audit logs, ECR vulnerability scanning, RDS Performance Insights, and ElastiCache metrics.

Install in 60 seconds

helm repo add k8s-telemetry-mcp https://kubeopsai.github.io/k8s-telemetry-mcp

helm install k8s-telemetry-mcp k8s-telemetry-mcp/k8s-telemetry-mcp -n monitoring --create-namespace

Ask your AI assistant

"Why did the payment pod crash in the last hour?"

"Is the checkout service meeting its 99.9% SLO this week?"

"Which namespace is consuming the most resources?"

"Who deleted the payment-service deployment?"

"Which ECR images have critical vulnerabilities?"

"What deployments went out in the last 30 minutes?"

🔒

Security first. All 23 tools are strictly read-only — no writes, no scaling, no restarts. Common secret and PII patterns are redacted before output reaches your AI assistant. Communicates over stdio via kubectl exec — no ingress, no exposed ports, no API key to rotate.


KubeOpsAI Agent — $199/mo, 1 cluster

3 AM alert. RCA in Slack. Nobody woken up.

Alertmanager fires a webhook. The agent runs the full diagnostic engine across logs, metrics, events, and deployments. A root-cause analysis lands in Slack before your on-call engineer opens their laptop.

🚨
Alertmanager
fires webhook
→
📐
Deterministic evidence
collected & linked first
→
🤖
LLM investigates
Bedrock / Anthropic / OpenAI, 18 tools
→
✔️
Citations checked
against real evidence
→
💬
Slack RCA
root cause + actions

Evidence is collected and deterministically linked before the model runs. The model can pull in more evidence, explain it, and rank it — it does not get to invent a cause the linker didn't establish, and every citation it writes is checked against what was actually collected.

# incidents
🤖
KubeOpsAI APP 3:14 AM
🔴 PodOOMKilled — payments / checkout-api
Severity
CRITICAL
Namespace
payments
Service
checkout-api
Status
FIRING
Root Cause
checkout-api was OOMKilled due to an unbounded in-memory cache introduced in v2.4.1, deployed 14 minutes before the alert fired. Memory spiked from 180Mi to 512Mi limit.
Evidence
• K8s event: OOMKilled × 3 in 10 min (03:04–03:14 UTC)
• Memory: 180Mi → 512Mi limit hit after deploy v2.4.1
• Recent deploy: checkout-api v2.4.1 at 03:00:11 UTC
• Log pattern: "cache.put() called 12,000×/min" (new in v2.4.1)
Recommended Actions
1. Roll back checkout-api to v2.4.0 immediately
2. Add cache size limit (max 10,000 entries)
3. Raise memory limit to 768Mi as short-term mitigation
Deterministic evidence (established independently of the model above)
[STRONG] Deployment checkout-api rolled out (revision 12, image checkout:v2.4.1) preceded the OOMKilled event by 840s — basis: same_resource, evidence: k8s_deployment:payments/checkout-api@2026-.... This link was established by timestamp ordering and declared resource relationships, not by the model.
🔑

BYOK — Bring Your Own Key. The agent runs inside your VPC and you provide your own Bedrock, Anthropic, or OpenAI key, so inference is billed to you at cost and governed by your agreement with that provider. We never see your data or your tokens — there is no KubeOpsAI backend for them to reach. Choose Bedrock and the prompt never leaves AWS.


Under the Hood

One diagram, the whole pipeline

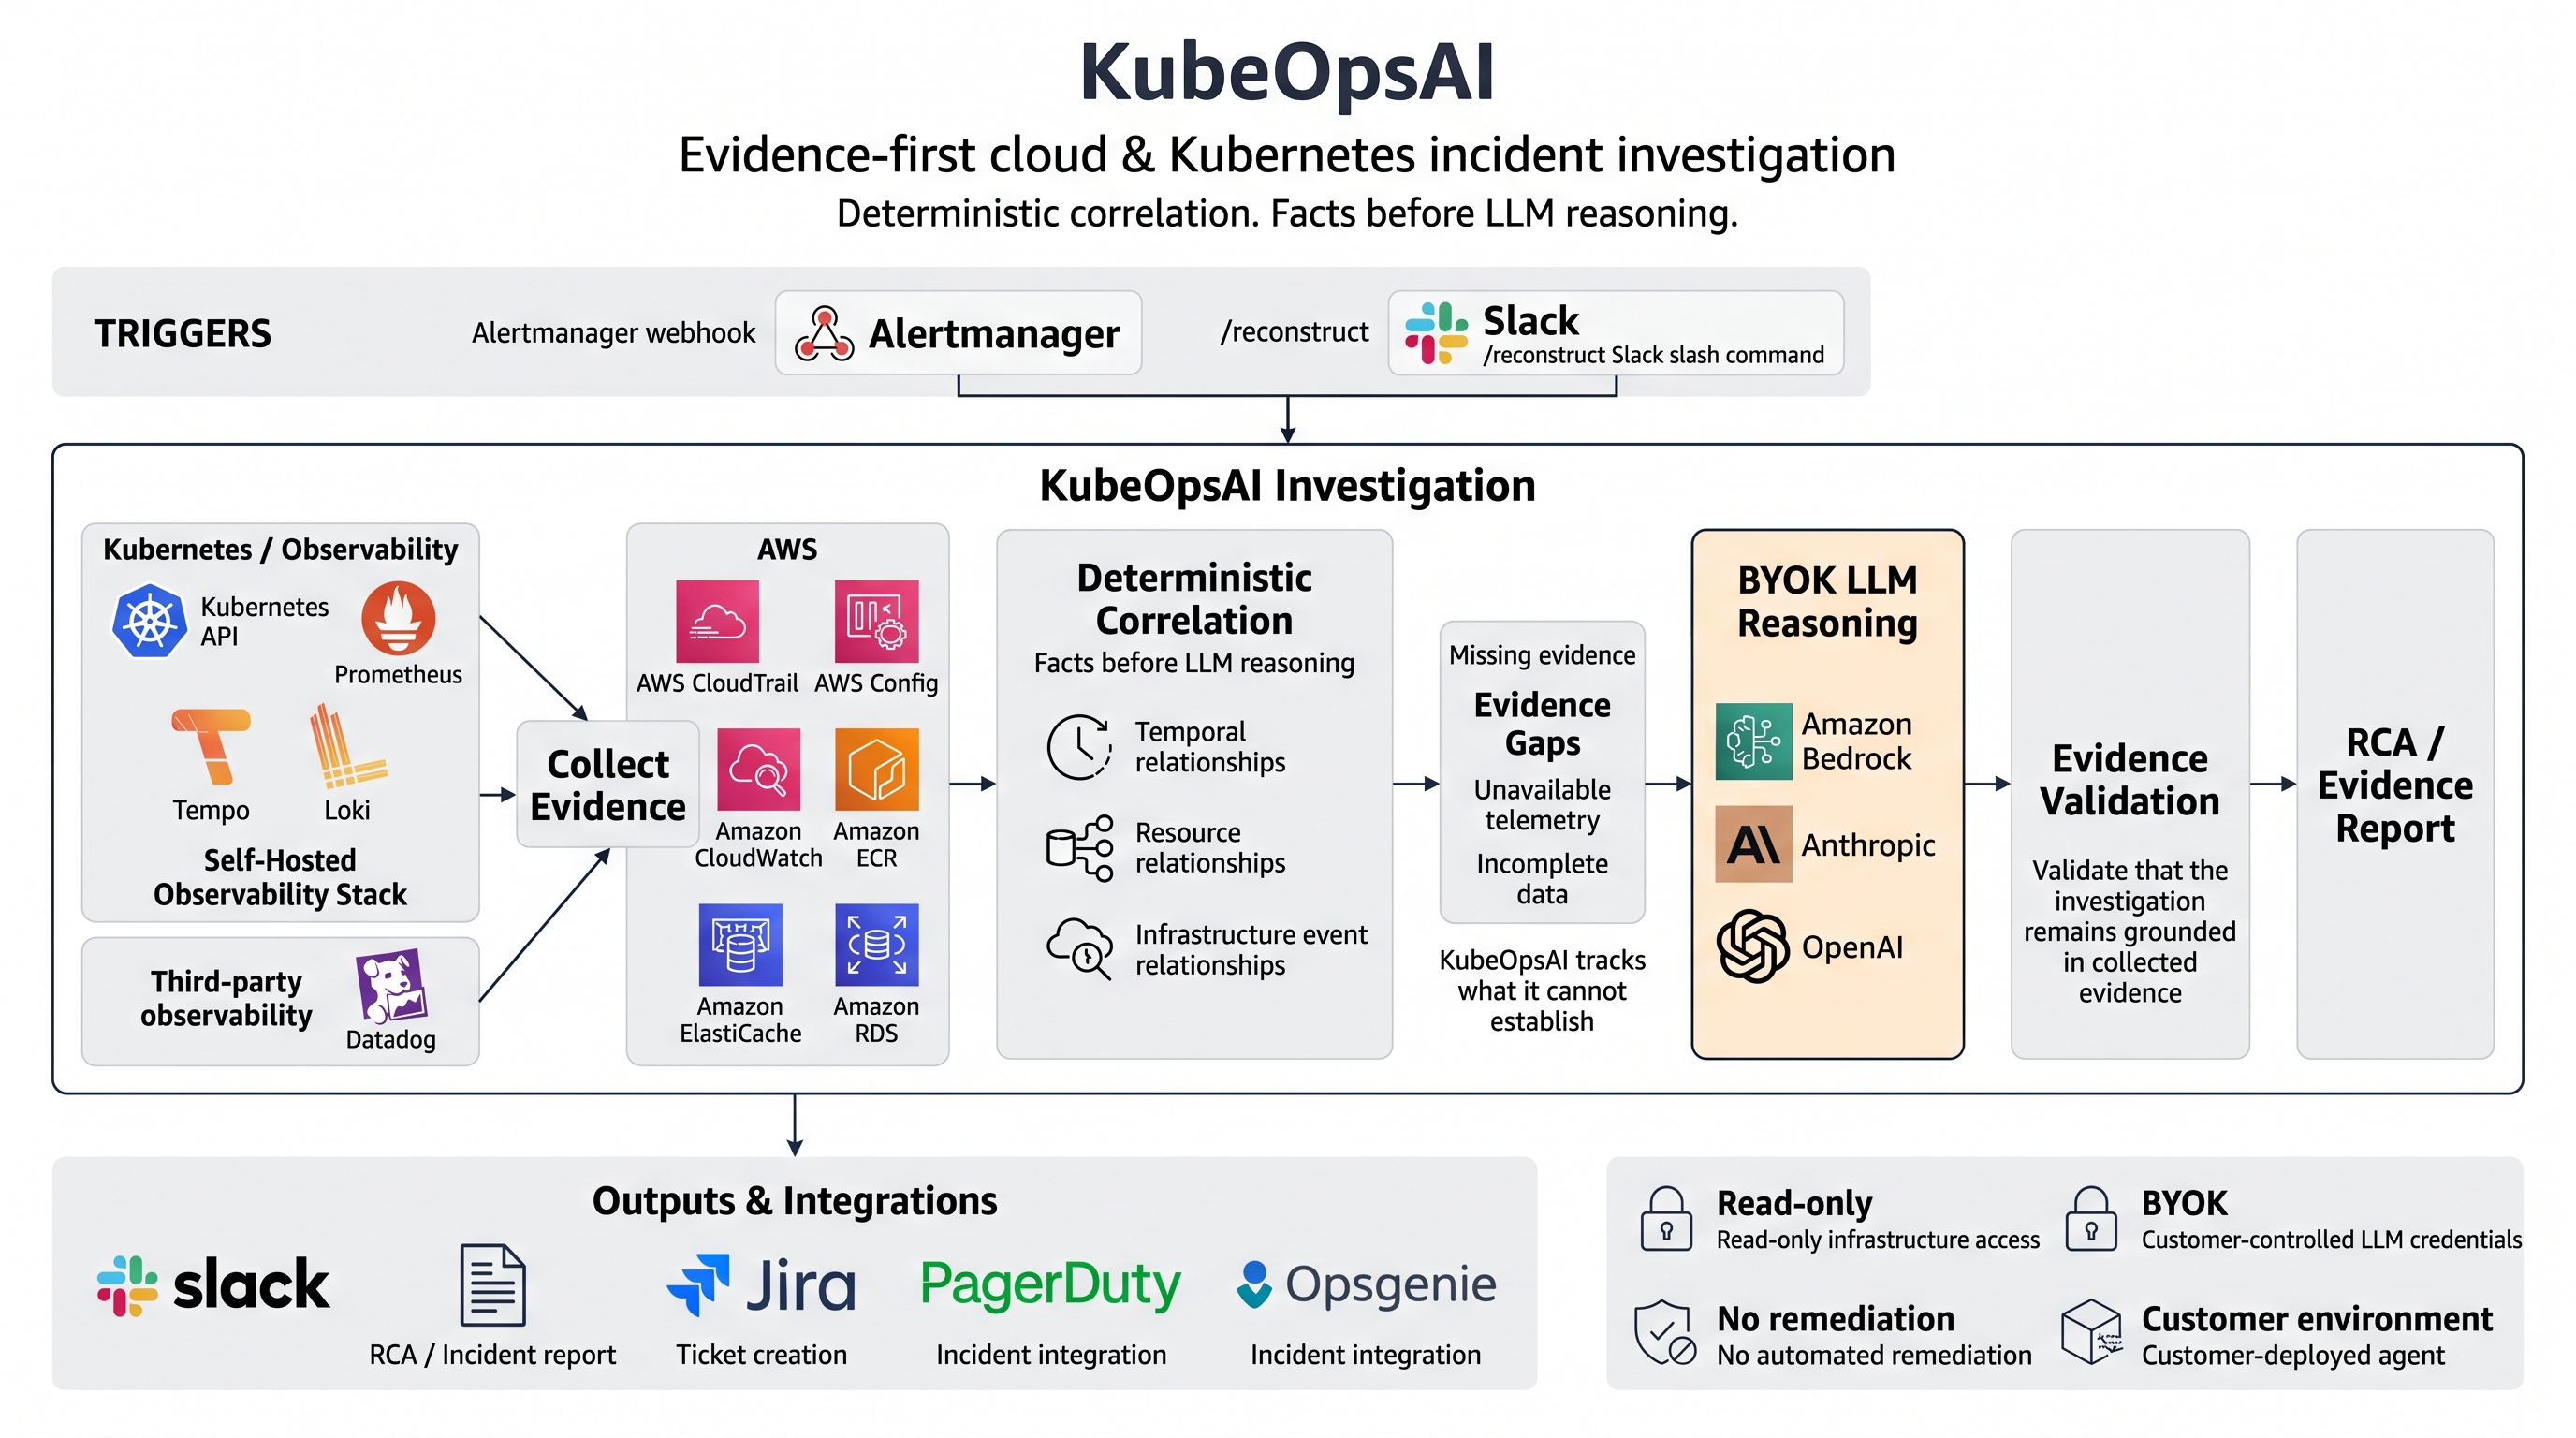
Every collector, every correlation step, every place a byte of your data is allowed to leave your environment — laid out end to end. Nothing in this diagram is aspirational; it maps directly onto the source you can read on GitHub.

KubeOpsAI architecture diagram: Alertmanager and Slack triggers feed a KubeOpsAI Investigation pipeline that collects evidence from Kubernetes, self-hosted observability (Prometheus, Tempo, Loki, Datadog) and AWS (CloudTrail, Config, CloudWatch, ECR, ElastiCache, RDS), links it deterministically by temporal, resource and infrastructure-event relationships, tracks evidence gaps, reasons over it with a bring-your-own-key LLM (Bedrock, Anthropic, or OpenAI), validates every claim against collected evidence, and outputs an RCA to Slack, Jira, PagerDuty or Opsgenie.
1 Collect evidence from your cluster, your observability stack and your AWS account — read-only, in parallel.
2 Link it deterministically by time, resource and infrastructure-event relationships, and record what it can't establish.
3 Only then does the LLM you bring reason over it — and every claim it makes is checked back against the evidence before it ships.

🔒 Security & Privacy

Your telemetry never reaches us.
That's not a policy. It's the architecture.

Every other incident response tool sends your logs, metrics, and traces to their SaaS platform. KubeOpsAI has no control plane and no SaaS backend: the agent runs inside your cluster and we never receive your data. It leaves your VPC in exactly two places you choose — the report posted to your Slack, and the prompt sent to your own LLM provider. Pick Bedrock and it never leaves AWS.

🏠

Runs in your cluster

The agent is a pod inside your EKS cluster. It queries your observability stack directly over the cluster network, so collection never crosses your VPC boundary and needs no outbound path to us.

👁️

Read-only by design

No tool can create, modify or delete an AWS or Kubernetes resource — those operations do not exist in the codebase. The agent investigates and reports; it writes only where you point it, to Slack and your ticketing system.

🔑

Bring your own LLM key

You provide your own Bedrock, Anthropic, or OpenAI key. We never see your API keys, your logs, your metrics, or your traces.

🧹

Secrets scrubbed

AWS keys, JWTs, bearer tokens, password= assignments, and database URIs are redacted before data reaches the LLM. Defence in depth, documented in full.

🌐

No ingress required

No load balancers, no exposed ports, no public endpoints. The MCP server communicates over stdio via kubectl exec.

📋

Scoped RBAC

A minimal ClusterRole grants get and list on events, nodes, pods, deployments, replicasets and HPAs — and nothing else. No secrets, no exec, no write verbs, no wildcards.

"Read-only by design. The agent investigates and explains. Your engineer makes the call and runs the fix. This is exactly why security teams approve it in 5 minutes instead of 6 months."

The reason enterprise security teams say yes on the first review.

Pricing

Simple, transparent pricing

KubeOpsAI is sold on AWS Marketplace, so charges appear on your monthly AWS invoice and draw on your existing committed spend. The MCP server is free and open source on GitHub — no subscription, no account needed.

MCP Server — Free
$0 forever
Manual querying via AI assistants during business hours

  • 23 tools, fully unlocked
  • Amazon Q, Claude, Kiro, Cursor
  • Loki, Prometheus, Tempo, K8s API, AWS
  • Apache 2.0 open source
  • Community support via GitHub
Enterprise
$699/month
Unlimited clusters, full integrations, auditable

  • Everything in KubeOpsAI Agent
  • Unlimited clusters — one price, any scale
  • Jira ticket auto-creation from RCA
  • Scheduled digests — daily/weekly incident summaries
  • Audit log to S3 or CloudWatch — every tool call logged
  • Custom LLM endpoint — private Bedrock or any OpenAI-compatible gateway
  • Dedicated onboarding & setup call
  • Priority support — 24 business hours to first response
  • Private Slack channel with your team

All paid plans billed through AWS Marketplace — charges appear on your existing AWS invoice. Contact us for enterprise pricing.


Support

We're here when you need us

Business hours: Monday–Friday, 09:00–18:00 CET. All support via email and GitHub Issues.

Product First Response Channel
MCP Server (Free) Best effort GitHub Issues
KubeOpsAI — Reconstruction ($199/mo · 1 cluster) 2 business days Email + GitHub Issues
KubeOpsAI — Enterprise ($699/mo · unlimited clusters) 24 business hours Email + private Slack channel
Email Support
MCP Server Issues
Documentation

About

About KubeOpsAI

We build Kubernetes observability tooling for AI assistants and autonomous incident response.

Engineering teams spend too much time switching between dashboards, running manual queries, and piecing together context during incidents. We built K8s Telemetry MCP Server to eliminate that friction — letting your AI assistant do the querying while you focus on fixing the problem.

KubeOpsAI Agent takes it further: when nobody is at a keyboard, the agent runs the full diagnostic engine automatically and delivers a root-cause analysis to Slack. One prevented 3 AM page pays for months of subscription.


Contact

Get in touch

Sales inquiries, support, or general questions.

General Inquiries
Technical Support